Open Data Standards & Tidy Data
A basic overview of open data standards and best practices.
The open data publishing process from start-to-finish
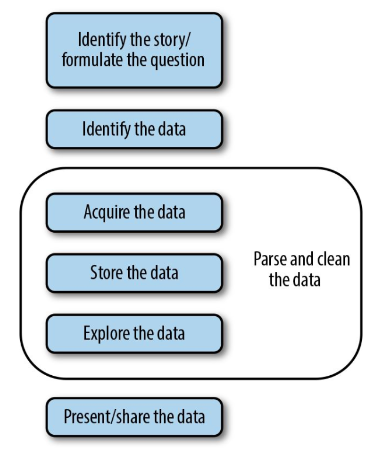
This flowchart displays the steps of the open data publishing process.
Datasets, Resources and Groups
How DKAN organizes data
All open data catalogs built on DKAN are organized by Datasets, Resources and Groups.
These three content types serve as a means of organizing data for maximum site functionality, efficiency, and user-friendliness.
You can picture a DKAN-based open data portal as a massive file cabinet, as in the below diagram:
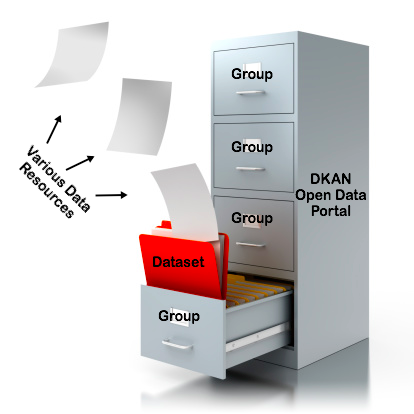
This image displays a DKAN Open Data site as a file cabinet with Datasets, Resources and Groups represented as folders, files and drawers.
| Datasets: | Datasets are used to group related pieces of data and their associated metadata. These pieces of data - known as Resources - can then be found under a single url along with descriptions and licensing information. Datasets serve as the folders for the Resources within. In real life, a typical folder could contain a printed spreadsheet, a PDF of a map, and a CD-ROM within it. In DKAN, you can similarly add a wide number of Resources in various formats to a single Dataset. |
|---|---|
| Resources: | In DKAN, Resources are the actual files, APIs or links that are being shared within a Dataset. See the “Dataset” definition for an image of a Dataset containing two Resources. Resource types include csv, html, xls, json, xlsx, doc, docx, rdf, txt, jpg, png, gif, tiff, pdf, odf, ods, odt, tsv, geojson and xml files. If the Resource is an API, it can be used as a live source of information for building a site or application. Resources can be viewed within your browser using DKAN Data Previews or used to create visualizations. |
| Groups: | Each Group is home to Datasets and Resources that share a common publisher. Typically, the publisher is an organization or governmental agency (i.e. Dept. of Education, Health Care Administration, Transit Authority, etc.). Groups also enable you to assign roles and permissions to members of the group. By adding users to the Group’s membership roster, you can create and manage a community based around the data within the group. |
Metadata
The “Who, What, When, Where, Why” of data
What is metadata?
As mentioned above, metadata is the “Who, What, When, Where, Why” of data.
To return to the file cabinet metaphor, metadata is the information written on the outside of each folder about the folder itself and the contents within.
Metadata contains the attributes that describe each dataset. Examples include the name of the dataset’s author, the title of the dataset, the date that it was last updated, any relevant contact information associated with the dataset, and more.
Metadata can be qualitative or quantitative in nature. Quantitative data is data that can be evaluated numerically; if the variable can be counted or measured, it’s quantitative. Qualitative data is data that is descriptive, and cannot be measured.
An example of qualitative metadata:
“Author: Leslie Knope, Agency: Dept. of Parks and Recreation.”
An example of quantitative metadata:
“Downloaded: 311 times, Last Accessed: 03-16-2016, 5:51 p.m.”
Where is metadata displayed in DKAN?
When viewing a dataset, you can scroll down the page to the “Dataset Info” section to view its metadata.
The screencap below is an example of metadata for the “Safety Net Clinics” dataset on HealthData.gov:
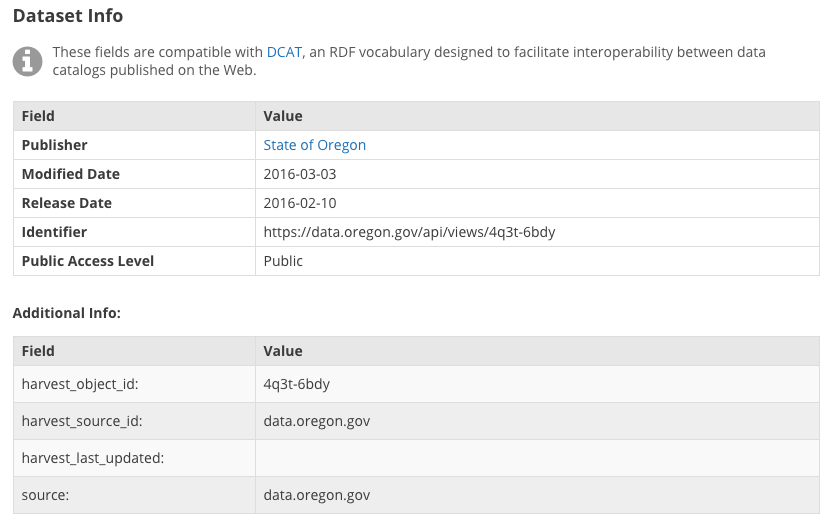
Metadata in DKAN is displayed as a table on the Datasets page
An example of how metadata is presented within DKAN.
Source: * https://www.healthdata.gov/dataset/safety-net-clinics
Open Data Formats
An open data format is a file format for storing digital data, defined by a published specification usually maintained by a standards organization, and which can be used and implemented by anyone.
Common open file formats include csv, html, xls, json, xlsx, doc, docx, rdf, txt, jpg, png, gif, tiff, pdf, odf, ods, odt, tsv, geojson and xml files.
All of the above file formats are supported as data resources in DKAN.
CSV Files
Introduction
A CSV (comma-separated values) file stores tabular data (numbers and text) in plain text, with each line of the file serving as a data record. Each record is made up of one or more fields, separated by commas - this usage of the comma as a field separator explains the name of the format.
In plain English, CSV files are a handy way to store data that could otherwise be displayed as a table. The structure of CSV files makes them easy to parse by nearly every database, spreadsheet or statistical analysis application in existence - including, of course, DKAN.
Here is an example of how a CSV file stores a table containing the quiz grades of four students, sorted by date:
“Date”,”Student”,”Grade”
“March 16th”,”Smith, Sally”,”A”
“March 25th”,”Williams, Jane”,”B”
“April 1st”,”Smith, Sally”,”C”
“April 8th”,”Doe, Jonathan “”Johnny”“”,”A”
Exported as a table, it looks very similar:
| Date | Student | Grade |
|---|---|---|
| March 16th | Smith, Sally | A |
| March 25th | Williams, Jane | B |
| April 1st | Smith, Sally | C |
| April 8th | Doe, Jonathan “Johnny” | A |
Each field is separated by a comma, and each new line represents a separate data record.
There are no official standards for the CSV file format itself, given that it has been in use since 1972 before such file format standards existed. That’s right - this widely-accessible format that can store millions of data records in a single file has existed and been in continuous use since the days of punch-card computing.
This is because CSV files have always been easy to type, are less prone to producing incorrect results if a record is entered incorrectly, and as shown above, is easily human-readable. These are still the major advantages of the format when it comes to viewing, editing, accessing and storing open data.
Possible issues with storing data resources in CSV format
One issue users may encounter with delimiter-separated files is the usage of an alternative delimiter such as a semicolon or tab instead of a comma. These files may be mistakenly saved as .csv files, causing problems when a program built to parse comma-delimited files attempts to read them. **
CSV Files vs. Microsoft Excel (.XLS) files in DKAN
CSV files can also only contain one “page” of data; therefore, unlike in Microsoft Excel, you cannot save a “workbook” with multiple pages representing multiple tables.
For example, if you had multiple pages of student grade data in Excel - one for the students of the Fall 2015 class, one for the Spring 2016 class and another for Summer 2016 - these would have to be saved as three separate CSV files.
On the other hand, CSV files can contain millions upon millions of rows. There is literally no limit to how long they can be, making them more practical than XLS files, which can only contain 65536 rows and 256 columns.
When would you need millions of rows? Examples include: All of the traffic tickets issued by a major metropolitan city within a calendar year, or open transit data containing a data record for every single bus arrival at every bus stop for every single route in the city. For NYC, these real-life open data files are truly massive, beyond what Excel can handle.
Issues you may encounter when importing data via Microsoft Excel
Excel will open .csv files, but as mentioned, depending on the system’s regional settings, it may expect a semicolon as a separator as opposed to a comma. This is because, in some countries and languages, the comma is used as the decimal separator. (i.e. displaying the number 3.14 as 3,14.)
Excel may also auto-reformat what looks like numbers, eliminating leading + or 0 characters. This can break data records starting with those characters, such as phone numbers. Many regional versions of Excel also cannot deal with Unicode in CSV files.
One solution when encountering these issues while attempting to open a CSV file in Excel is to change the filename extension from .csv to .txt; then opening the file manually with the Excel “Open” command. This will allow you to manually specify the delimiters, encoding, format of columns, etc. A preview is displayed so that you can be sure the file looks the way you want it to.
When saving a CSV file in Excel, a prompt will appear warning you that Excel’s formatting cannot be saved with the file. This is referring to formatting you may have applied to the file such as bold text, special colors or fonts, added images or anything else that goes beyond the limitations of the format.Each field is separated by a comma, and each new line represents a separate data record.
Data Standards 101
Data is more useful when more people can use it.
What are data standards?
Data standards are the rules that help keep the publishing and organization of open data orderly and efficient.
If you’re a writer, you may be familiar with the various stylebooks used to standardize the writing and design of documents in terms of grammar, punctuation and sources cited.
Examples include the AP Stylebook for news reports, and the Chicago and MLA manuals of style for academic papers. You can think of the various guidelines in the stylebooks as data standards applied to written content.
A listing of common standards for open data has been provided within this document.
Why do data standards matter?
Standards for data and metadata formatting and organization matter because of interoperability and functionality between datasets.
One of the most important parts of data analysis is figuring out the relationships between data resources - and if multiple resources have been prepared in a single standardized format, it makes comparing them between one another far more efficient.
One example that pertaining to data standardization is how dates are formatted:
April 2, 1974
04-02-74
04/02/1974
4/2/74
19740402
04021974 - is this April 2 or February 4?
2 April 1974
If you were trying to compare or join together datasets from different sources, each of which used a different format for their date variable, it would be a much more difficult task than if a common date format had been decided upon ahead of time.
For a listing of open data standards resources, please proceed to the bottom of this document.
What makes open data truly ‘open’?
The determination of whether data is truly open comes down to three categories:
Availability and Access
- The data must be available in a convenient and modifiable form.
- It can be linked to and easily shared with others.
- It has been provided in a standard, structured format so that it is machine-readable and can be easily manipulated.
- Guaranteed availability and consistency over time regarding the data itself as well as its accompanying metadata.
- The data can be traced back to where it originates.
Reuse and Redistribution
- Open data is data that is free to access, use and share.
- Universal Participation: The general public must be able to use, re-use and redistribute the data.
Best Practices for “Tidy Data”
Data cleaning
Data cleaning - also known as data wrangling - is the process of detecting and correcting (or removing) corrupt or inaccurate records from a record set, table, or database.
Cleaning and reorganizing data before it is published on an open data portal is time-consuming but necessary. Not only is it one of the first steps that must be performed when publishing data, but it may end up being repeated many times as new problems come to light or new data is collected. Tidying data makes the sharing and publishing of data more efficient.
Tidying data makes the publishing, sharing and interoperability of data more efficient, and allows it to be read by more software platforms and operating systems than it otherwise would be.
By adhering to tidy data standards, data publishers can ensure that their data can be as accessible as possible to the widest number of users.
What makes tidy data ‘tidy’?
Like families, tidy datasets are all alike but every messy dataset is messy in its own way.
Tidy datasets are:
- Easy to manipulate
- Easy to model
- Easy to visualize
Tidy datasets also have a specific structure that comes down to three simple rules:
- Each variable is a column.
- Each observation is a row.
- Each type of observational unit is a table.
The following example of student grades is a ‘tidy’ data table: “Date,” “Student,” and “Grade,” are all variables, and have been given columns. The observations - corresponding to the dates of each test - have each been given a row.
| Test Date | Student | Grade |
|---|---|---|
| March 16th | Smith, Sally | A |
| March 25th | Williams, Jane | B |
| April 1st | Smith, Sally | C |
| April 8th | Doe, Jonathan “Johnny” | A |
What makes data untidy?
Anything that makes accessibility or visualization difficult can be considered untidy.
A table stored within a Word file is a good example of untidy data because the formatting-within-formatting keeps the data from being machine-readable.
Releasing personally identifying data about individuals or data violating local, national or international privacy laws is not only unethical, but also very much untidy.
How to create quality metadata
Checklist for quality metadata
To provide quality metadata to users, it is essential to include all of the descriptive information necessary to locate, understand, and use Dataset and its associated Resources.
Metadata should be written in a standard format according to the following best practices:
- Write simply, completely, and consistently. General users should be able to understand your metadata and, therefore, understand the Dataset.
- Use taxonomies Taxonomies limit terms to those that can be auto-filled and therefore ensure standardization. Within DKAN, Tags and Topics are two examples of taxonomies, also known as “controlled vocabularies.”
- Use specific and descriptive tags. Tags are essential for users browsing though Datasets and Resources.
- Provide an appropriate and descriptive title for your Dataset: For example, the title “Geographic Distribution of City Parks Department Expenditures FY2016” gives users a pretty good idea of what the data is about.
- Clearly state data limitations, if applicable: One example would be noting usage constraints such as metadata for a map shapefile that advises “Not to be used for navigational purposes.”
- Avoid using special characters: The following characters are examples that may affect your metadata’s machine-readability: !, @, <, >, (, )
- Review your metadata’s accuracy: Take a second look at your metadata, and perhaps even ask a colleague if they can look it over.
Most importantly, you may ask yourself:
- Could someone use an automatic search to locate this data set?
- Could they assess its usefulness?
- Do your metadata include enough specific information to uniquely identify and locate any geospatial data based solely on your documentation?
- Can a novice understand what you wrote?
- Does the documentation adequately present all the information needed to use or reuse the data represented?
- Are your key words descriptive enough to help other people find your data set?
- Have you used enough broad terms? Have you used enough narrow terms?
Guidelines For Releasing Data or Statistics In Spreadsheets
Follow these simple guidelines to make your data or statistical releases as tidy and useful as possible.
- Don’t merge cells. Sorting and other manipulations people may want to apply to your data assume that each cell belongs to one row and column.
- Don’t mix data and metadata (e.g. date of release, name of author) in the same sheet.
- The first row of a data sheet should contain column headers. None of these headers should be duplicates or blank. The column header should clearly indicate which units are used in that column, where this makes sense.
- The remaining rows should contain data, one datum per row. Don’t include aggregate statistics such as TOTAL or AVERAGE. You can put aggregate statistics in a separate sheet, if they are important.
- Numbers in cells should just be numbers. Don’t put commas in them, or stars after them, or anything else. If you need to add an annotation to some rows, use a separate column.
- Use standard identifiers: e.g. identify countries using [ISO 3166](https://en.wikipedia.org/wiki/ISO_3166) codes rather than names.
- Don’t use only color or other stylistic cues to encode information. If you want to color cells according to their value, use conditional formatting.
- Leave the cell blank if a value is not available.
- If you provide pivot tables, make sure the underlying data is available separately too.
- If you also want to create a human-friendly presentation of the data, do so by creating another sheet in the same workbook and referencing the appropriate cells in the data sheet.
More Data Cleaning Resources
https://cran.r-project.org/web/packages/tidyr/vignettes/tidy-data.html
https://vita.had.co.nz/papers/tidy-data.html
https://en.wikipedia.org/wiki/Data_cleansing
http://www.ats.ucla.edu/stat/sas/library/nesug99/ss123.pdf
https://betterevaluation.org/sites/default/files/data_cleaning.pdf
Open Data Standards Resources
Official governing bodies and non-profit organizations:
Project Open Data
https://project-open-data.cio.gov/
https://project-open-data.cio.gov/open-standards/
Project Open Data is the United States’ official policy regarding open data publishing and metadata standards. The homepage explains the mission and goals of Project Open Data and its participants, and the Open Standards page lists standards, specifications, and formats supporting open data objectives.
Links to best practices for data standards are also provided: International Standards, US National Standards, and US Federal Government Standards.
Gov.UK - Working With Open Standards
https://www.gov.uk/service-manual/technology/working-with-open-standards
The United Kingdom’s official guide to working with open data standards, approved by the Open Standards Board at the Government Digital Service.
Code for America: Guide to Making Open Data Useful
http://archive.codeforamerica.org/our-work/data-formats/
Code for America builds open source civic-focused technology and has organized “a network of people dedicated to making government services simple, effective, and easy to use.” This guide explains the necessity of open data formats in plain English - very useful for the less technically-inclined.
List of Civic Data Standards:
Johns Hopkins University’s GovEx Labs
https://labs.centerforgov.org/open-data/civic-data-standards/
Johns Hopkins University’s GovEx labs’ defines a civic data standard as “an an open, collaboratively developed set of data schematics or semantics which facilitates interoperability between multiple providers and consumers for the public good.”
This site provides a listing of civic data standards that GovEx labs have identified so far, with the disclaimer that they vary greatly in terms of active communities, current use, and approaches used for development.
The Open Contracting Partnership
Open Contracting Data Standard
https://www.open-contracting.org/data-standard/
http://standard.open-contracting.org/latest/en/
The Open Contracting Partnership is an organization composed of stakeholders and subject matter experts regarding government contracting. They “work across sectors and along the whole process of government contracting to use the power of open data to save governments money and time, deliver better goods and services for citizens, prevent corruption, and to create a better business environment for all.”
The Open Contracting Data Standard (OCDS) “enables disclosure of data and documents at all stages of the contracting process by defining a common data model. It was created to support organisations to increase contracting transparency, and allow deeper analysis of contracting data by a wide range of users.”
The Open Data Foundation
Academic Resources
http://www.opendatafoundation.org/?lvl1=resources&lvl2=papers
The Open Data Foundation, a U.S. based nonprofit, has provided an annotated bibliography of academic papers and other published works regarding open data publishing and the open data community.
The Open Data Institute
Open Data Maturity Model
https://theodi.org/guides/maturity-model (other guides: https://theodi.org/guides)
The Open Data Institute is a London-based independent non-profit dedicated to using open data to address today’s global challenges. The Open Data Maturity Model is “a way to assess how well an organisation publishes and consumes open data, and identifies actions for improvement.
The model is based around five themes and five progress levels. Each theme represents a broad area of operations within an organisation. Each theme is broken into areas of activity, which can then be used to assess progress.”
Open Knowledge International
The Open Data Handbook
https://opendatahandbook.org/guide/en/
Open Knowledge International is “a worldwide non-profit network of people passionate about openness, using advocacy, technology and training to unlock information and enable people to work with it to create and share knowledge.”
This handbook discusses the legal, social and technical aspects of open data, as well as the why, what and how of open data – why to go open, what opening up your data means, and the how to ‘open’ data.
The Sunlight Foundation
Open Data Policy Guidelines
https://sunlightfoundation.com/opendataguidelines/
The Sunlight Foundation is “a nonpartisan nonprofit that advocates for open government globally and uses technology to make government more accountable to all.” Their list of open data guidelines addresses what data should be public, how to make data public, and how to implement policy.
Additional Open Data Community Resources
5- Star Data Scoring
An independent project regarding the costs and benefits of open data:
“Tim Berners-Lee, the inventor of the Web and Linked Data initiator, suggested a 5-star deployment scheme for Open Data. Here, we give examples for each step of the stars and explain costs and benefits that come along with it.”
Open Data Services
CoVE - Convert, Validate and Explore
http://cove.opendataservices.coop/ https://github.com/OpenDataServices/cove/
Open Data Services are a United Kingdom based cooperative that provides “technologies, support, and services relating to the production, standardization and use of [socially impactful] open data.”
Their CoVE (Convert, Validate and Explore) web application currently supports two open data standards: The 360Giving Data Standard, and the Open Contracting Data Standard.
360Giving Data Standard
http://cove.opendataservices.coop/360/
“360Giving provides support for grantmakers to publish their grants data openly, to understand their data, and to use the data to create online tools that make grant-making more effective.”
The Open Contracting Data Standard
http://standard.open-contracting.org/validator/
“The Open Contracting Data Standard promotes the effective use of contracting data, helping users to ‘follow the money’, and it provides a clear template for governments wishing to disclose their data.”
The Open Data Substrate
GitHub project to catalog open data standardization efforts
https://open-data-standards.github.io/
“The goal of this industry organization is to provide a forum to quickly establish standards so that Open Data implementors can ensure they are developing Open Data solutions that interoperate. This community-driven initiative to promote vendor interoperability and data portability is derived from a fundamental belief that ‘data is more useful’ when ‘more people can use it’.”
The 8 Principles of Open Government Data
Democratic guidelines regarding open data best practices
For more information, see: https://opengovdata.org/
Background
“On December 7-8, 2007, thirty open government advocates gathered in Sebastopol, California and wrote a set of eight principles of open government data.
This page annotates the original 8 principles and links to additional principles found around the web.”
The Original 8 Principles of Open Government Data [Source]:
“Government data shall be considered open if it is made public in a way that complies with the principles below:”
- Complete All public data is made available. Public data is data that is not subject to valid privacy, security or privilege limitations.
- Primary Data is as collected at the source, with the highest possible level of granularity, not in aggregate or modified forms.
- Timely Data is made available as quickly as necessary to preserve the value of the data.
- Accessible Data is available to the widest range of users for the widest range of purposes.
- Machine processable Data is reasonably structured to allow automated processing.
- Non-discriminatory Data is available to anyone, with no requirement of registration.
- Non-proprietary Data is available in a format over which no entity has exclusive control.
- License-free Data is not subject to any copyright, patent, trademark or trade secret regulation. Reasonable privacy, security and privilege restrictions may be allowed.
Relevant Reading Materials
“Enabling Civic Data Standards” - by Andrew Nicklin, Trainer of Chief Data Officers at the Johns Hopkins University’s Center for Government Excellence GovEx Labs. https://medium.com/@technickle/enabling-civic-data-standards-e38b0c40e3a#.hm37j1c5r
“Open Data Standards” W3C blog post: https://www.linkedin.com/pulse/open-data-standards-steven-adler